The Impact of the NAR Lawsuit on the Mortgage and Real Estate Industries
Major Lawsuit Against National Association of Realtors Progresses as Class Action
South Florida's Most Affordable Housing: Rentals
Possible Recession Signs: Examining the Economic Landscape
Inflation Moderation Nears, Federal Reserve Advances
September 2022: South Florida Real Estate Stats
Real Estate Market Forecast in South Florida for 2023
Miami Real Estate Snapshot - August 2023
Vera Fund: 2022 Results and 2023 Strategy
How to become an accredited investor
July 2022: South Florida Real Estate Stats
Advantages of the South Florida Real Estate Rental Market
How to start investing with Vera Fund
August 2022: South Florida Real Estate Stats
Vera Fund's Cryptocurrency Real Estate Investments
The collapse of the banking sector in the USA
Promising investment directions of Vera Fund
Greenberg Traurig Renews Miami Lease
Time To Use A Florida 1031 Exchange
Why does a foreigner buy real estate in Florida?
December 2022: South Florida Real Estate Stats
Key Criteria for South Florida Commercial Real Estate Investment
November 2022: South Florida Real Estate Stats
Aug. 30, 2022
August 2022: South Florida Real Estate Stats
The traditional review of the residential real estate market in August 2022 in five counties of South Florida, such as Miami-Dade, Broward, Palm Beach, Martin, St. Lucie, in the segments of single-family houses, condominiums and townhouses for readers of the Vera Realty Site was done by Nick Polyushkin, an expert, licensed broker and head of the Vera Realty real estate company.
As always, Nick Polyushkin draws readers' attention to new trends in the residential real estate market in August 2022.
The review is based on the reports of the Miami Association of Realtors (https://www.miamirealtors.com/).
Statistics for August 2022 are compared with data for August 2021. Some indicators are considered in the change from the previous month.
Housing market in South Florida in August 2022
Home sales statistics for August 2022 continue to show that South Florida remains one of the most attractive places to live in the US

Nick Polyushkin, an expert, licensed broker and head of the Vera Realty real estate company, said: "In general, the summer of 2022 in the residential real estate market turned out to be in some ways passive. August in Florida is always characterized by slow sales rates, which is explained by the preparation process of families for starting a new school year and the search for some home stability.
As I said earlier, the volume of inventory has been gradually increasing over the past 4 months for approaching a stable level of 6 months’ supply.
The Seller's market began to gradually move to the Buyer's market, since the Buyer had the opportunity to choose real estate objects. Those who wanted to buy apartments at this time did it without much bargaining, since the cost of apartments, of course, was much less than houses.
Summing up the information on the five districts, we can highlight the trend of the residential real estate market in August 2022: inventories are growing almost everywhere; there is an increase in prices for single-family homes, townhouses and condominiums; negative data in the volume of transactions continue to persist.
Let's analyze the statistics of the residential real estate market for August 2022 based on the information the Miami Association of Realtors (https://www.miamirealtors.com/).
Statistics indicators of the residential real estate market in South Florida
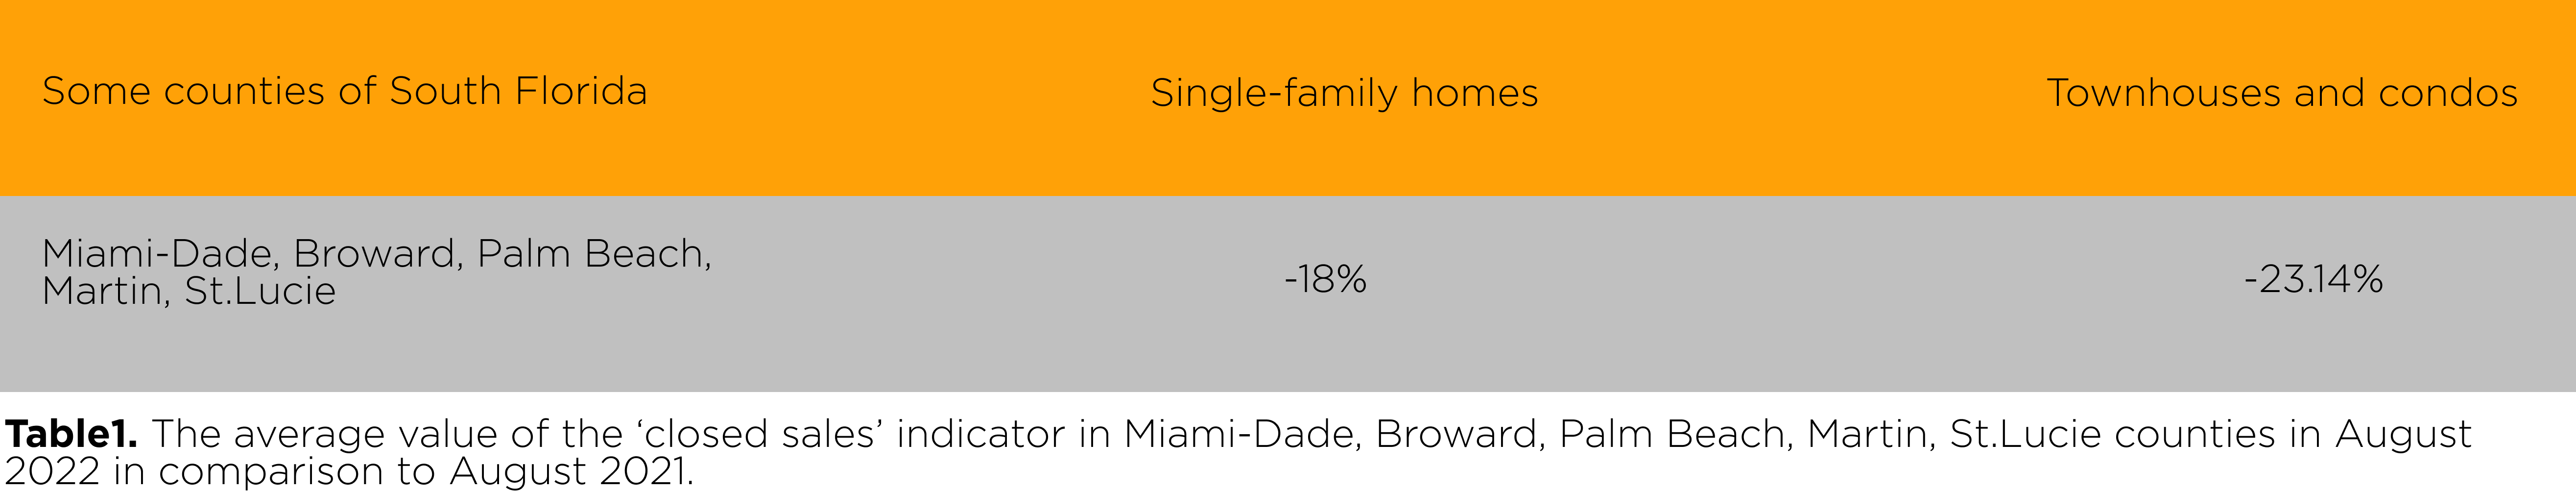
- Closed sales
In August 2022, in Miami-Dade County closed sales for single-family homes decreased to -26.2% compared to August 2021 (July, 2022: -27,2 %). The decline for townhouses and condominiums was -26% compared to August 2021, and 13 percent higher than in July 2022.
In Broward County, closed sales for single-family homes were down -26%, and for townhouses and condos was -16.6%.
In Palm Beach County, closed sales for single-family homes were down -20,4%, and for townhouses and condos were -29.7%.
In Martin County, closed sales of single-family homes continued to decline to -17.6%, but not as much as in July 2022 (-46.9%); the decline for townhouses and condominiums was no longer.
In St. Lucie, this indicator for single-family homes was down -5.3% (July, 2022: -18%) compared to August 2021; and for townhouses and condominiums was -28.3% (July, 2022: - 34.1%)
In August 2022, compared to August 2021, changes in five counties of South Florida were characterized by a decrease in single-family homes to -18%, and for townhouses and condominiums to -23.14%. If we compare the indicator of July 2022 and August 2022, the increase in this indicator in five districts in relation to single-family homes was 13.76%, and for townhouses and condominiums 10.28%.
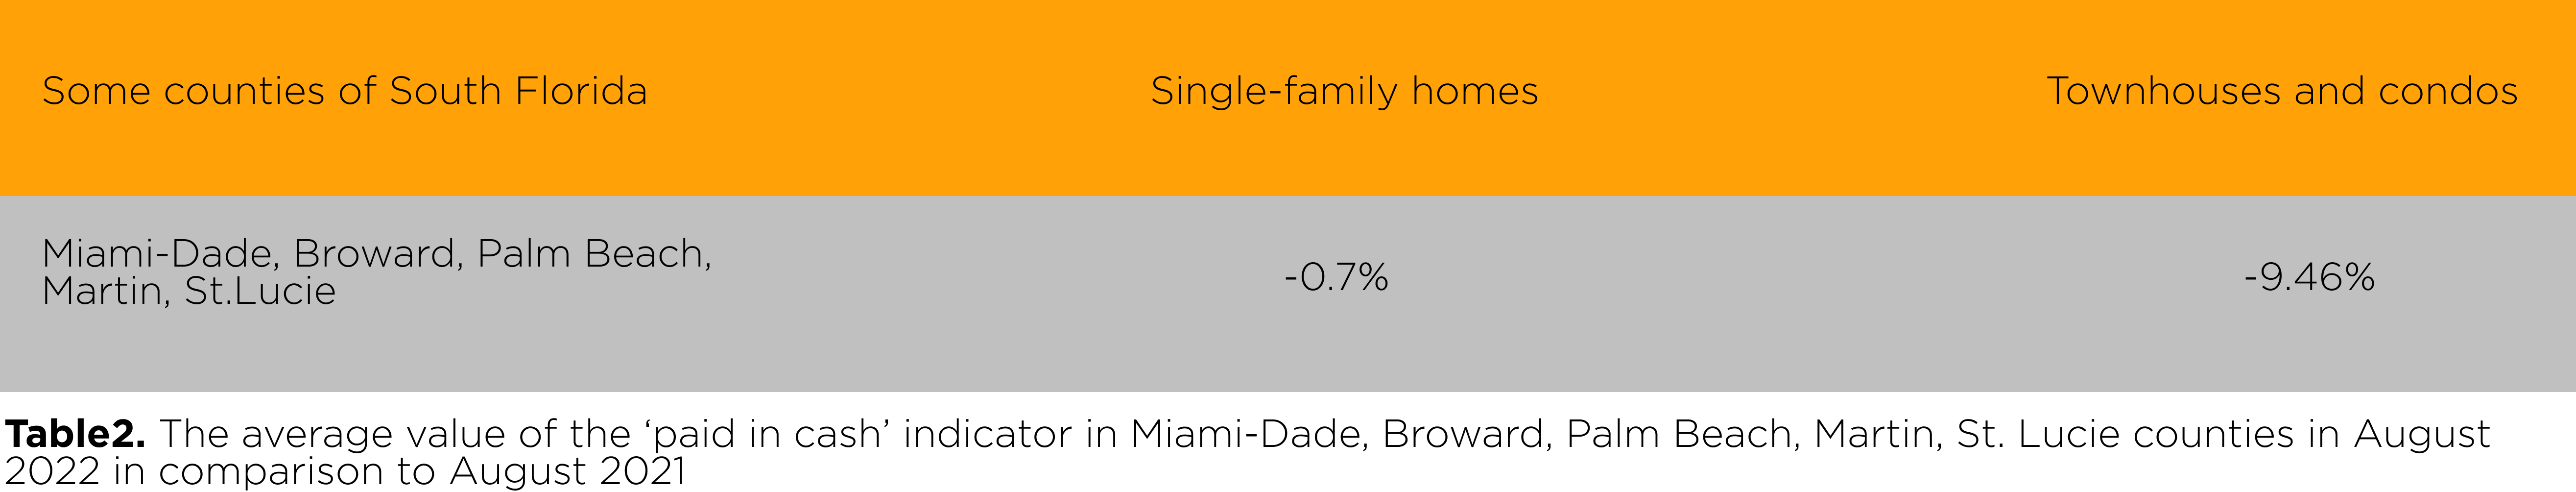
- Paid in cash
Cash transactions in three Miami-Dade, Broward and Palm Beach counties remain in negative numbers. In addition, in Martin and St. Lucie counties, they went from plus to minus.
In August 2022, сash payments for the purchase of single-family homes in Miami-Dade County grew only to +12.2% compared to August 2021. For townhouses and condominiums in the same area, this indicator changed from plus (July, 2022: +6.9% ) to minus to -0.8% (August, 2022).
In Broward County, cash payments for single-family homes decreased from +18.9% (July, 2022) to +3.6% (August, 2022), and for townhouses and condominiums from +6.1% (July, 2022) to +5.1%(August, 2022).
In Palm Beach County, the drop in prices for single-family homes was from +12.1% (July, 2022) to +1% (August, 2022), but for townhouses and condominiums, the changes were insignificant in the direction of growth from +0.7% (July, 2022) to +0.8% (August, 2022).
In Martin County, changes in this indicator for single-family homes were from +21.0% (July, 2022) to -2.2% (August, 2022), and for townhouses and condominiums from +41.0% (July, 2022) to - 14.9% (August, 2022).
In St. Lucie, the change in payment for single-family homes was from +4.6% (July, 2022) to -18.1% (August, 2022), and for townhouses and condominiums from -16% (July, 2022) to -37.6% (August, 2022).
The average statistics of the ‘paid in cash’ indicator in the five districts under consideration in August 2022 for single-family homes was no longer +13.78% (July, 2022), but only -0.7% (August, 2022) compared to this period in 2021, and for townhouses and condominiums the indicator decreased from +7.64% (July, 2022) to -9.46% (August, 2022), compared to August 202
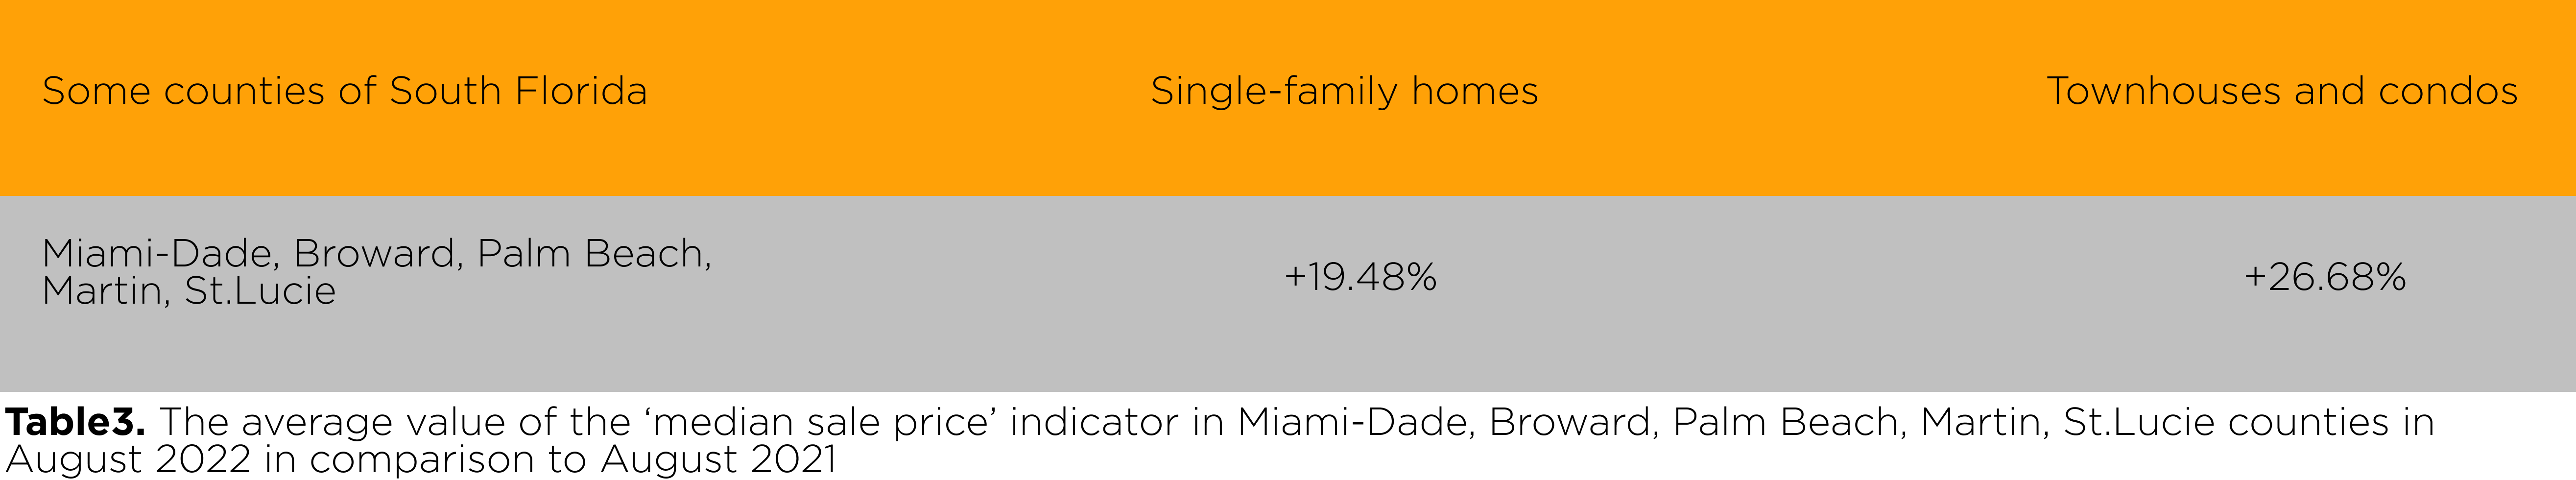
- Median sale price
The increase in median prices for residential real estate for single-family homes, as well as for condominiums and townhouses compared to August 2021 and July 2022 has changed upward, but not so significantly, except for price changes in Martin County. Home prices continue to be impacted by the supply of inventory.
In Miami-Dade County, the median sale price of single-family homes increased to only +10.1% compared to the previous August 2021, and as for townhouses and condominiums, this indicator also increased slightly to +11.9%.
In Broward County, median sale price for single-family homes was up +13.6%, and for townhouses and condos - it was a +20.6% increase.
In Palm Beach County, median prices for single-family homes were up +17.7%, and for townhouses and condominiums they grew to +25.4%.
In Martin County, the price for single-family homes jumped by +33.3% (July, 2022: +18.8%), and for townhouses and condos was +47.6% (July, 2022: +35.8%)
In St. Lucie, the indicator for single-family homes increased to +22.7%, and for townhouses and condominiums it was +27.9% compared to August 2021.
In August 2022, in the selected counties of South Florida, the average values for single-family homes increased to +19.48% compared to August 2021, and for townhouses and condominiums - to +26.68%. If we compare the change in prices since July 2022, then housing prices increased by 0.14%, and for condominiums - by 3.46%.There is a slow rise in prices, but still growth.
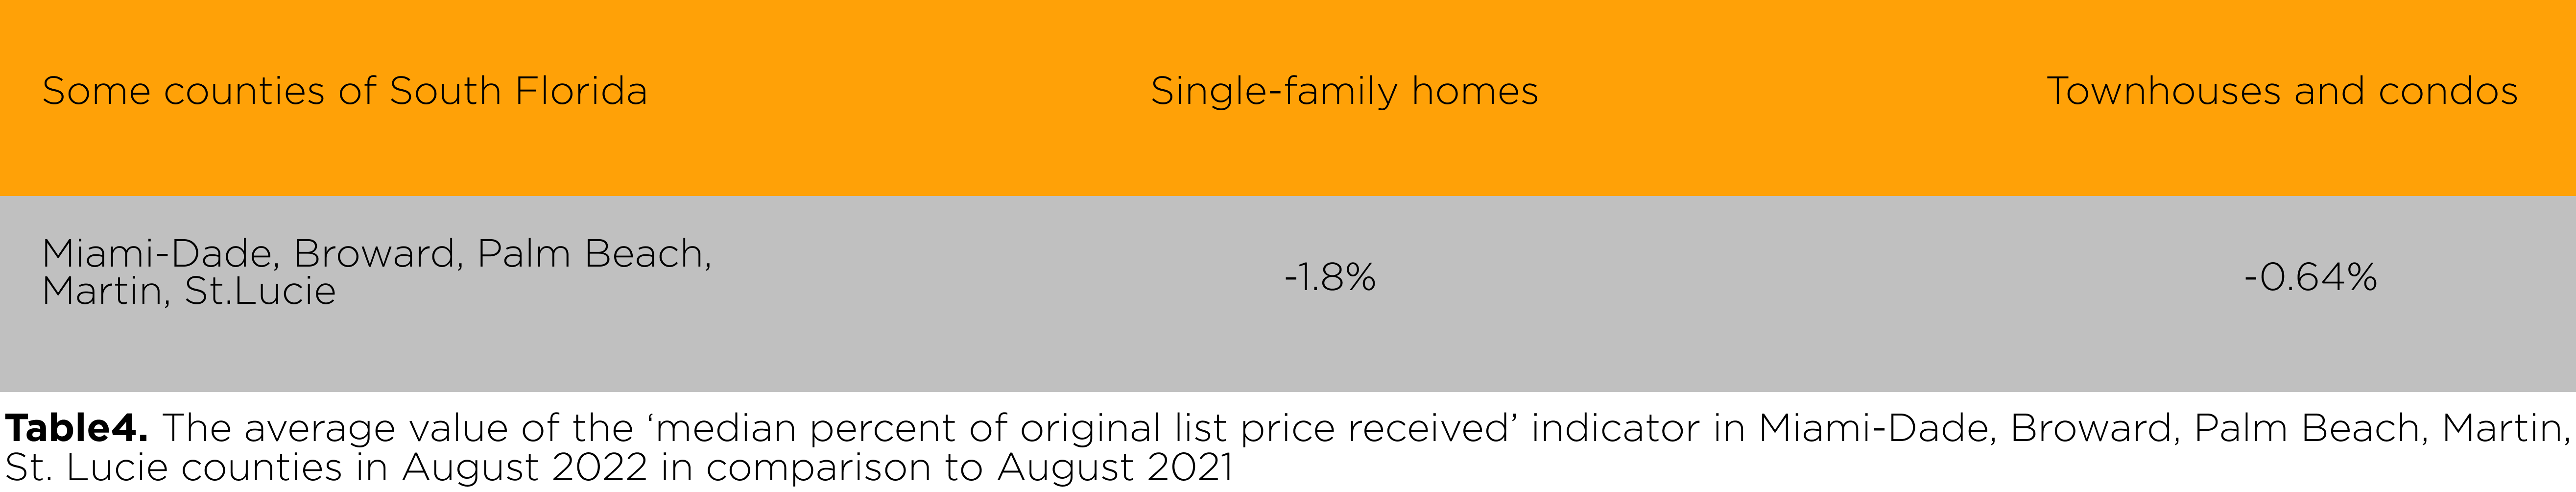
- Median percent of original list price received
In August 2022, in all five districts, the ‘median percent of original list price received’ indicator for single-family homes was -1.8% compared to August 2021, and for townhouses and condominiums -0.64%. If we correlate August 2022 with July 2022, there is a decrease in this indicator for single-family homes by 0.6%, as well as for condominiums and townhouses by about 0.92%. We notice the presence of elements of bargaining in a number of segments.
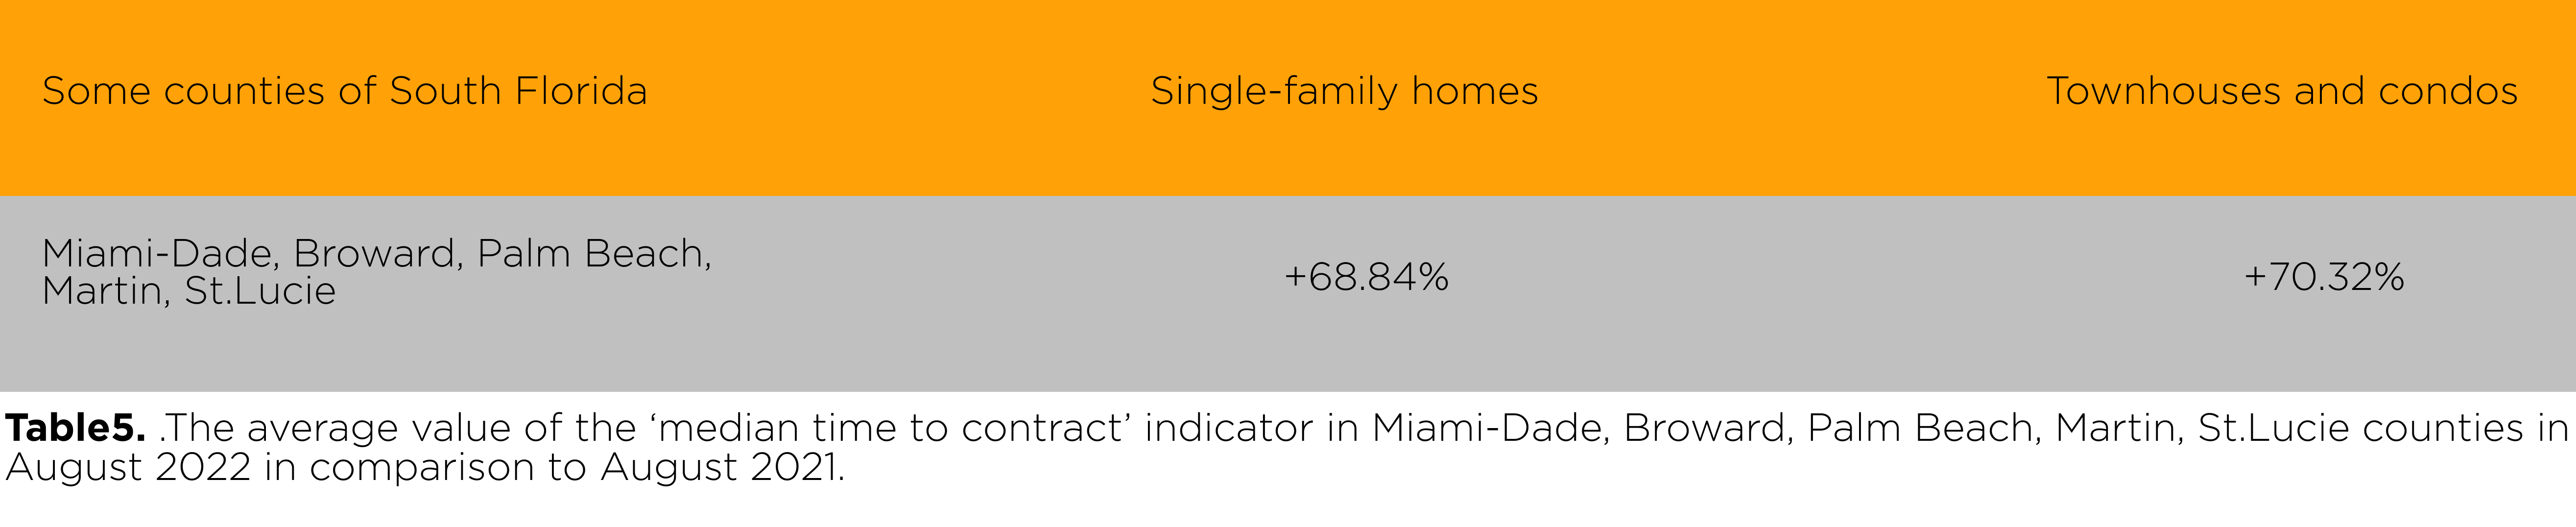
- Median time to contract
In almost all counties of our observation, there is a significant increase in the ‘median time to contract’ indicator in August 2022. In Broward County, in the segment of ‘condominiums and townhouses’, the indicator was declining.
In Miami-Dade County, for the segment 'single-family homes' this indicator was +77.8% compared to August 2021, and for ‘townhouses and condominiums’ +125%.
In Broward County during this period for single-family homes the indicator was up +50%, but for townhouses and condominiums, on the contrary, it decreased by -33.3%.
In Palm Beach County, the median time to conclude a contract for the purchase of single-family homes again increased to +63.64%, and for townhouses and condos to +6.3%.
In Martin County, the increase of the indicator for single-family homes was +75%, and for townhouses and condominiums, the indicator jumped from minus values to +128.6%.
In St. Lucie, an increase of median time to contract for single-family homes was +77.8%, and an increase for townhouses and condos was +125%.
As for August 2022, in five districts, a significant increase in the considered indicator for single-family homes was +68.84% compared to August 2021. For townhouses and condominiums, the indicator value changed from minus to plus and amounted to +70%.
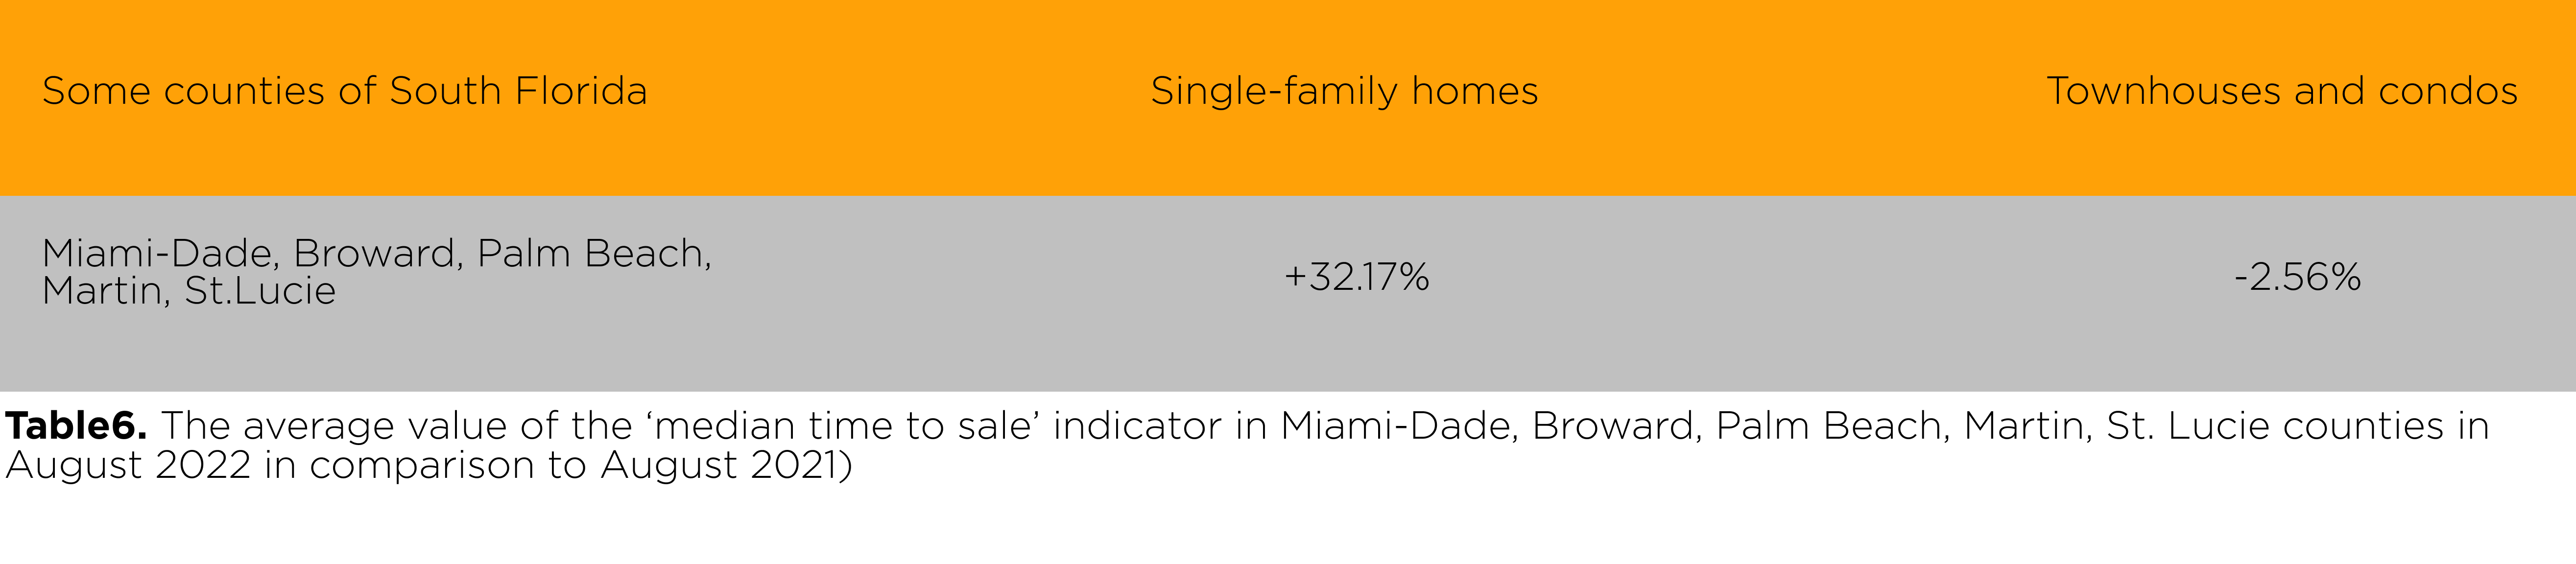
- Median time to sale
In August 2022, in the five districts under consideration, the ‘median time to sale’ indicator for single-family homes began to grow from -1.84% (July, 2022) to +32.17% (August, 2022) compared to August 2021, and for townhouses and condominiums from -13.68% (July, 2022) to -2.56% (August, 2022)
In the current August, real estate transactions took from 54 to 65 days, depending on the types of real estate, and the area itself.
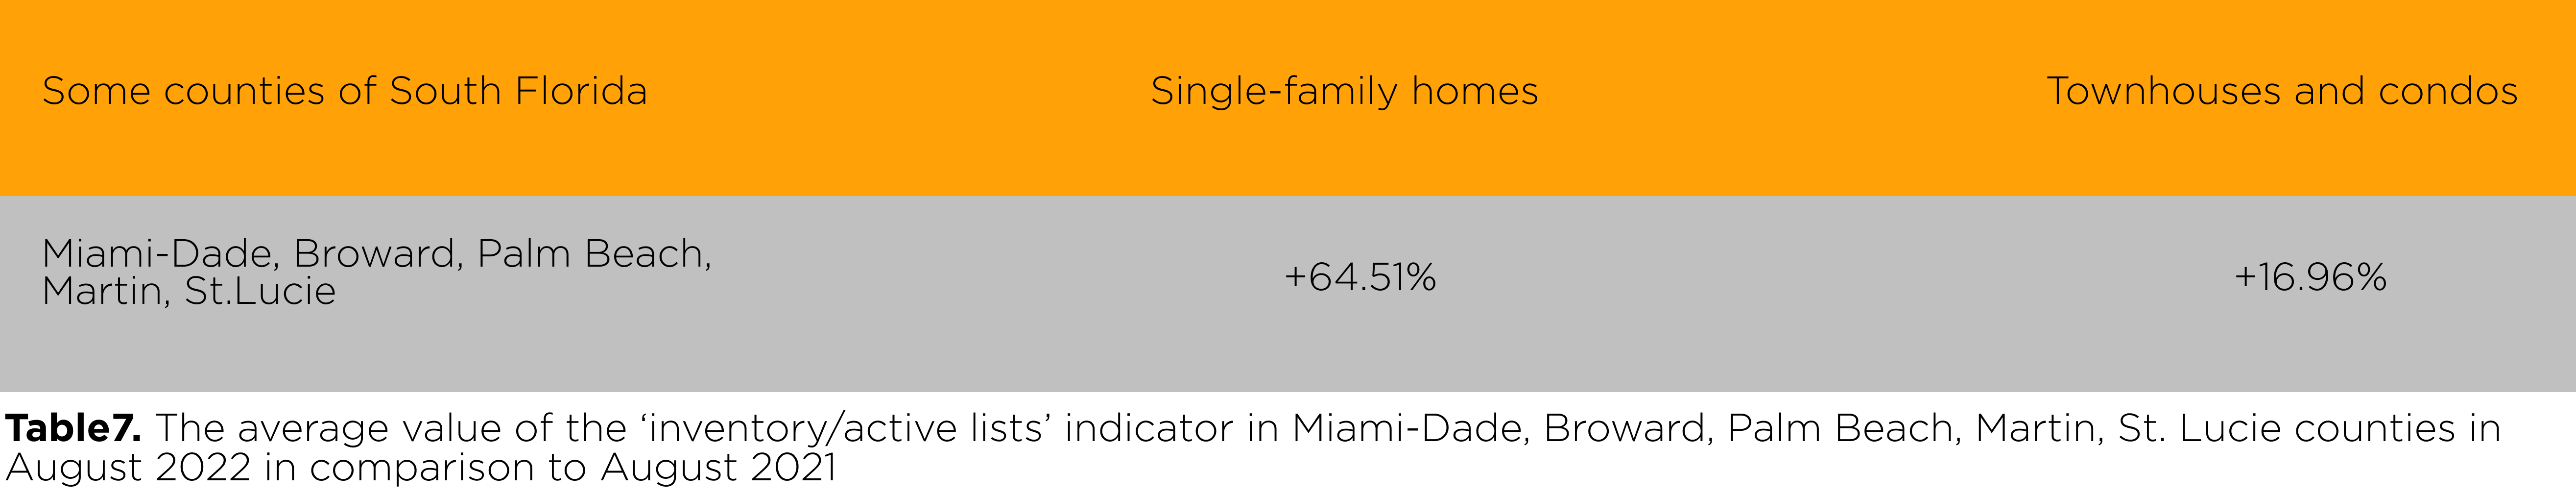
- Inventory/active lists
The general trend of August 2022 repeats July 2022. New offers continue to appear in some segments. St. Lucie is still interesting, where the new ads has already grown to 125%. Active offers for condominiums and townhouses were reduced only in Miami-Dade and Broward.
According to August 2022 statistics in Miami-Dade County, the number of inventory in active lists for single-family homes was up from +26% (July, 2022) to +26.6% (August,2022), if compared to the previous August 2021. In the same county, for townhouses and condominiums, this figure dropped to -23.8%.
In Broward County, the rate of inventory for single-family homes was from +37.2% (July, 2022) to +46.7% (August, 2022), and for townhouses and condos from -12.4% (July,2022) to -7% (August, 2022).
In Palm Beach County, the index of active inventory for single-family homes changed up from +54.59% (July,2022) to +63.15% (August,2022), and for townhouses and condos it increased from +20% (July, 2022) to +28.3% (August, 2022).
In Martin County, the growth of the indicator for single-family homes was observed up from +6.6% (July,2022) to +62.3% (August, 2022), and for townhouses and condos it changed from +51.1% (July,2022) to +56.3% (August, 2022).
In St. Lucie, an ongoing growth for single-family homes from +117% (July, 2022) to +124.4% (August 2022), while the changes for townhouses and condos were from 68.1% (July, 2022) to +31% (August, 2022).
In August 2022, the total growth of active lists for the five districts was +64.51% compared to August 2021, and for townhouses and condominiums, the change was +16.96.
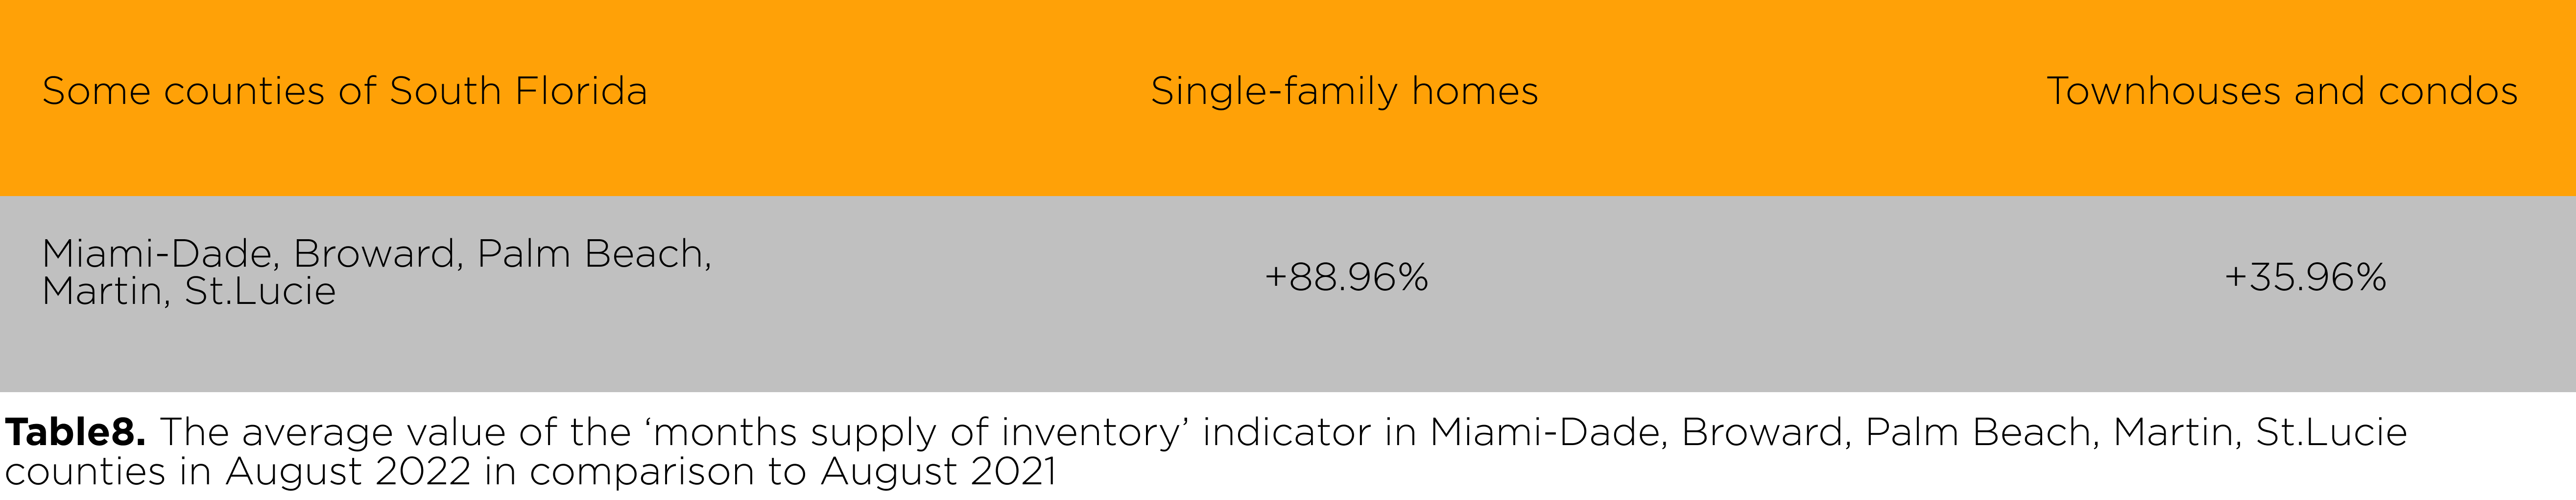
- Months supply of inventory
In August 2022 the months supply inventory continues to increase in some counties for some segments and reaches a value of 3 month.
In Miami-Dade and Broward counties, months supply of inventory for condominiums and townhouses although observed, but still has negative values, respectively: -26.1% (Miami-Dade) and 0% (Broward).
As it stands, the supply for single-family homes changed up from +81.34% (July, 2022) to +88.96% (August, 2022), and for townhouses and condos from +41.32% (July, 2022) to +35.36% (August, 2022).
The months' supply of inventory for single-family homes in Miami-Dade County was up +43.5% (3,3 months) , compared to the previous August 2021.
In Broward County, the monthly inventory supply for single-family homes was up to +66.7% to 2,5 months, while this indicator for for townhouses and condos was 0%.
In Palm Beach County, the monthly inventory supply index for single-family homes continued to grow from +80% (July, 2022) to 92.9% (2.7 months) already in August 2022 compared to August of the previous year, and for townhouses and condominiums from +33.3% (July, 2022) to 40% in August 2022.
In Martin County, the indicator for single-family homes was +116.7% (2.7 months), and for townhouses and condominiums it has already grown to +90.9%.
In St. Lucie, the inventory supply for single-family homes continues to grow from +109.1% (July, 2022) to +125% in August 2022; and for townhouses and condominiums, changes have occurred from +133.3% (July, 2022) to +75% in August 2022.